
1. Introduction to Splunk
In today’s digital environment, organizations generate enormous amounts of machine data every second. Servers, computers, firewalls, routers, applications, databases, cloud platforms and security devices continuously generate logs and event information.
Analyzing this data manually is difficult, particularly when an organization manages hundreds or thousands of IT systems.
Splunk is a powerful data analytics and monitoring platform that collects, indexes, searches, monitors and analyzes machine-generated data. It helps organizations understand what is happening across their IT infrastructure, identify security threats, troubleshoot technical problems and monitor application performance.
Splunk is widely used in:
- Security Information and Event Management (SIEM).
- Security Operations Centers (SOC).
- Log management and analysis.
- IT infrastructure monitoring.
- Application performance monitoring.
- Incident investigation and threat detection.
- Compliance monitoring and auditing.
- Operational intelligence and business analytics.
One of Splunk’s most important capabilities is its Search Processing Language (SPL), which allows administrators and security analysts to search and analyze large volumes of machine data.
For example, a security analyst can use Splunk to investigate failed login attempts, identify suspicious IP addresses, detect unusual network activity and generate security reports.
For OpenVAS, please follow https://techadvice.tech/openvas-greenbone-complete-guide/
In simple terms, Splunk converts machine-generated data into meaningful and actionable information.
2. What is Splunk?
Splunk is a software platform designed to collect and analyze machine-generated data from different sources.
It can ingest data in multiple formats, including:
- System logs.
- Application logs.
- Windows Event Logs.
- Linux system logs.
- Firewall logs.
- Network device logs.
- Database logs.
- Cloud infrastructure logs.
- Security alerts.
- JSON, CSV and other structured or unstructured data.
Splunk processes this information and makes it searchable through its indexing and search capabilities.
Example
Suppose an organization has:
- 50 Windows servers.
- 30 Linux servers.
- 10 firewalls.
- 20 network switches.
- 5 database servers.
Each device generates logs independently. Without a centralized monitoring platform, administrators must log in to different systems to investigate problems.
With Splunk, logs from these systems can be collected and analyzed through a centralized interface.
Splunk Architecture:Components,Indexer & More
This centralized approach helps IT teams monitor infrastructure, investigate incidents and identify operational problems more efficiently.
3. History and Evolution of Splunk
Splunk was established in 2003 by Michael Baum, Rob Das and Erik Swan. The founders aimed to make machine-generated data easier to collect, search and analyze.
Before platforms such as Splunk became popular, administrators generally relied on separate log files and traditional monitoring tools. Searching through large amounts of log data was time-consuming and required considerable manual effort.
Splunk introduced a different approach by making machine data searchable through a centralized platform.
Important milestones in Splunk’s development
| Year | Development |
| 2003 | Splunk company founded. |
| 2006 | Early commercial Splunk product releases. |
| 2007 | Splunk became publicly available as a commercial platform. |
| 2012 | Splunk completed its initial public offering (IPO). |
| 2015 | Splunk expanded its security analytics and cloud capabilities. |
| 2017 | Continued development of enterprise security and IT operations solutions. |
| 2018 | Splunk introduced further cloud and machine-learning capabilities. |
| 2020 | Splunk expanded its cloud-first product strategy. |
| 2022 | Splunk continued developing its security operations and observability portfolio. |
| 2023 | Cisco announced an agreement to acquire Splunk. |
| 2024 | Cisco completed its acquisition of Splunk on March 18, 2024. |
Today, Splunk operates as part of Cisco and continues to provide solutions for security, observability, data analytics and IT operations.
Why did Splunk become popular?
Its popularity is associated with several capabilities:
- Centralized log management.
- Fast searching of machine-generated data.
- Real-time monitoring and alerting.
- Security event investigation.
- Customizable dashboards and reports.
- Integration with a wide range of IT technologies.
4. Splunk Products and Solutions
Splunk provides different products and solutions for different operational requirements.
1. Splunk Enterprise
An on-premises platform used for collecting, indexing, searching and analyzing machine data. It is commonly deployed in enterprise IT environments and SOC labs.
2. Splunk Cloud Platform
A cloud-hosted data analytics platform that provides Splunk’s search and analytics capabilities without requiring customers to manage the complete underlying infrastructure.
See Splunk ES asset and identity concept at Splunk Mumbai Splunk User Group
3. Splunk Enterprise Security (ES)
A security analytics solution designed to help SOC teams identify threats, investigate incidents, correlate security events and monitor suspicious activities.
4. Splunk SOAR
Security Orchestration, Automation and Response. It helps security teams automate repetitive incident response activities using playbooks and integrations.
Ensuring Success with Splunk ITSI – Part 1: Thresholding Basics | Splunk
5. Splunk IT Service Intelligence (ITSI)
Used for monitoring IT services, identifying service degradation and analyzing operational performance.
The availability, packaging and licensing of individual products can vary. Splunk Enterprise alone does not automatically include all the advanced capabilities of Enterprise Security or SOAR.
5. Major Use Cases of Splunk
Splunk can be used in different areas of IT infrastructure management and cybersecurity.
5.1 Security Information and Event Management (SIEM)
Splunk is widely used as a SIEM platform. It collects security logs from firewalls, servers, endpoints, authentication systems and network devices.
Security analysts can use it to:
- Detect multiple failed login attempts.
- Identify suspicious IP addresses.
- Monitor unauthorized access.
- Investigate malware-related activities.
- Identify abnormal network traffic.
- Correlate security events from different devices.
5.2 Log Management
Splunk collects and centralizes logs generated by different operating systems, applications and network devices.
For example, Linux administrators can monitor:
- /var/log/auth.log
- /var/log/syslog
- /var/log/messages
- Application-specific log files.
This makes troubleshooting and investigation easier.
5.3 Network Monitoring
Network administrators can use Splunk to analyze logs from:
- Cisco routers and switches.
- Firewalls.
- VPN gateways.
- IDS/IPS systems.
- DNS servers.
- Proxy servers.
It can help identify unusual traffic patterns, connection failures and suspicious network activities.
5.4 Infrastructure Monitoring
Splunk can help IT teams monitor server availability, system errors, CPU-related events, application failures and infrastructure health.
5.5 Incident Response
When a security incident occurs, analysts can search historical logs to identify:
- When the incident started.
- Which systems were affected.
- Which user accounts were involved.
- What suspicious activities occurred.
- Whether similar activities happened previously.
5.6 Compliance and Auditing
Organizations can use Splunk to support security monitoring and audit activities associated with standards and regulatory requirements, such as:
- ISO/IEC 27001:2022.
- PCI DSS.
- SOC 2.
- NIST Cybersecurity Framework.
- Internal IT security policies.
Splunk can provide evidence and reports, but installing the platform alone does not make an organization compliant with any standard.
6. Splunk Architecture
Understanding Splunk architecture is important before installing and configuring the platform.
Splunk uses a distributed architecture in which data collection, indexing, searching and reporting can be handled by different components.
6.1 Main Components of Splunk Architecture
1. Universal Forwarder (UF)
The Universal Forwarder is a lightweight agent installed on systems from which log data needs to be collected.
Its responsibilities include:
- Monitoring specified log files.
- Collecting system events.
- Forwarding data to Splunk indexers.
- Sending data securely over the network.
For example, a Universal Forwarder can be installed on a Linux server to forward authentication logs to a central Splunk server.
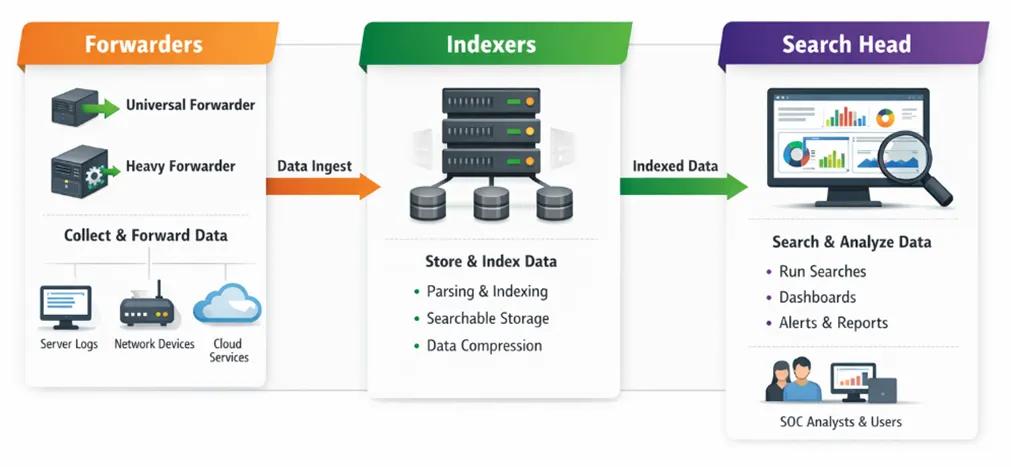
2. Heavy Forwarder (HF)
A Heavy Forwarder is a full Splunk Enterprise instance configured to collect and forward data.
Its functions include:
- Parsing incoming data.
- Filtering unnecessary events.
- Routing data to different indexers.
- Performing data transformations.
It consumes more resources than a Universal Forwarder.
3. Indexer
The indexer is responsible for processing and storing incoming data.
Its major functions include:
- Receiving data from forwarders.
- Processing incoming events.
- Creating searchable indexes.
- Storing raw event data and associated index information.
- Responding to search requests.
The indexer is one of the most important components in a distributed Splunk environment.
4. Search Head
The Search Head provides the user interface for searching, analyzing and visualizing indexed data.
It supports:
- Search queries.
- Reports.
- Dashboards.
- Alerts.
- Data visualization.
- Scheduled searches.
5. Deployment Server
The Deployment Server helps administrators centrally manage and distribute configurations and applications to groups of Universal Forwarders.
6. License Manager
The license management component monitors Splunk license usage and helps administrators manage licensing entitlements.
6.2 How Splunk Architecture Works
The general data flow is:
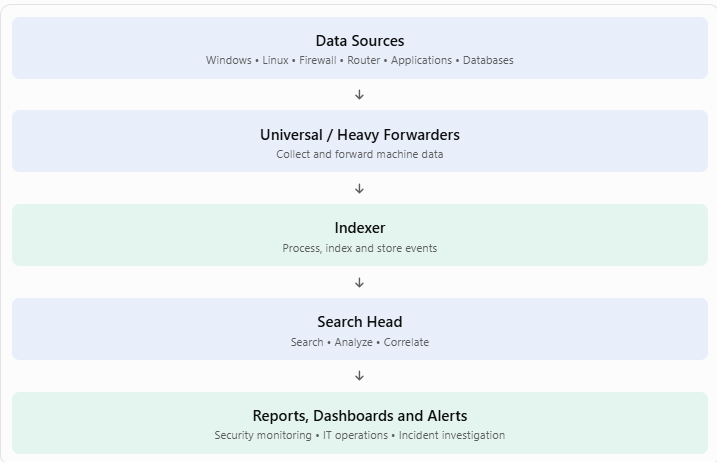
Data Sources
Windows • Linux • Firewall • Router • Applications • Databases
Universal / Heavy Forwarders
Collect and forward machine data
Indexer
Process, index and store events
Search Head
Search • Analyze • Correlate
Reports, Dashboards and Alerts
Security monitoring • IT operations • Incident investigation
For a small lab, all the main functions can run on one Splunk Enterprise instance. Large organizations generally distribute these functions across multiple servers for performance, scalability and availability.
6.3 Important Splunk Ports
| Port | Purpose |
| 8000 | Splunk Web interface (default) |
| 8089 | Management and REST API |
| 9997 | Receiving forwarded data (commonly configured) |
| 514 | Traditional Syslog (if configured) |
| 8088 | HTTP Event Collector (HEC), if enabled |
Ports must be enabled only when required and appropriately restricted through firewall rules.
7. Installation of Splunk on Windows
Splunk Enterprise can be installed on supported Windows Server environments. For a desktop Windows lab, check the current platform support matrix: Windows 11 is supported for the Universal Forwarder, but should not be assumed to be a supported Splunk Enterprise host.
Step 1: Download Splunk Enterprise
- Visit the official Splunk website.
- Create or sign in to your Splunk account.
- Navigate to Splunk Enterprise downloads.
- Select the supported Windows 64-bit installer.
- Download the installation package.
Official download page: Download Splunk Enterprise.
Step 2: Run the Installer
- Locate the downloaded .msi file.
- Double-click the installer.
- Accept the license agreement.
- Choose the installation directory.
- Configure the administrator username and password.
- Complete the installation.
Splunk: Setting up a SOC Lab | Tryhackme Walkthrough
Step 3: Start Splunk
After installation, open Windows Services and verify that the Splunk service is running.
Alternatively, open Command Prompt as Administrator and navigate to the Splunk installation directory.
Example:
cd “C:\Program Files\Splunk\bin”
splunk.exe start
To check the status:
splunk.exe status
To stop Splunk:
splunk.exe stop
Step 4: Access Splunk Web
Open a browser and enter:
http://localhost:8000
Log in using the administrator credentials configured during installation.
You should now be able to access the Splunk Enterprise interface.
Step 5: Add Data
From the Splunk interface:
- Open Settings.
- Select Add Data.
- Choose the data source.
- Select Upload, Monitor or Forward.
- Configure the input.
- Select the appropriate index.
- Complete the configuration.
For a Windows server, you can collect Windows Event Logs such as:
- Application.
- Security.
- System.
For Windows Event Log monitoring, use the appropriate Splunk input configuration or the Universal Forwarder.
8. Installation of Splunk on Linux
Linux is widely used for Splunk deployments, especially in enterprise environments and security monitoring labs.
The following example uses an Ubuntu/Debian-based system. Installation instructions differ slightly between Debian-based and RPM-based distributions.
Step 1: Update Linux Packages
Open the terminal and execute:
sudo apt update
sudo apt upgrade -y
Step 2: Download Splunk Enterprise
Download the appropriate Linux package from the official Splunk website.
Choose the Debian package (.deb) for Ubuntu/Debian systems.
Step 3: Install Splunk
After downloading the package, navigate to its directory and execute:
sudo dpkg -i splunk-*.deb
If dependency issues occur:
sudo apt –fix-broken install
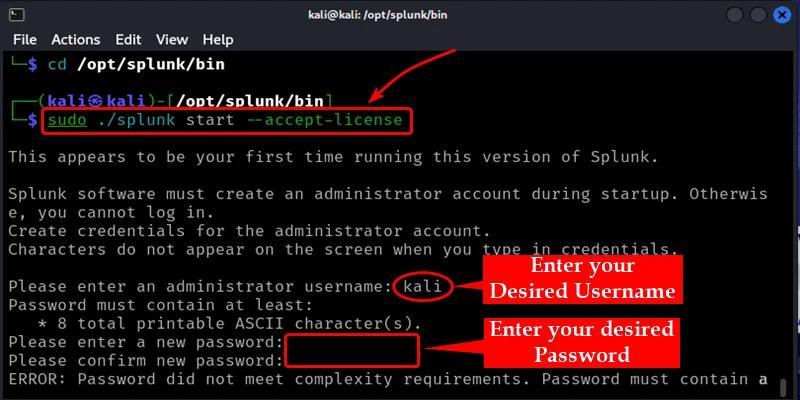
Step 4: Start Splunk
For a standard package installation:
sudo /opt/splunk/bin/splunk start –accept-license
During the initial setup, configure the administrator account according to the installer prompts.
Step 5: Enable Splunk at Boot
sudo /opt/splunk/bin/splunk enable boot-start
Step 6: Check Splunk Status
sudo /opt/splunk/bin/splunk status
Step 7: Access Splunk Web
Open a browser and visit:
http://SERVER-IP:8000
For example:
http://192.168.1.100:8000
Hands on Lab: Sandboxing with Splunk with Docker (from .conf2017) | Splunk
Installation on Red Hat, Rocky Linux and RHEL
For RPM-based distributions, download the appropriate RPM package from Splunk.
Install it using:
sudo rpm -ivh splunk-*.rpm
Start the service:
sudo /opt/splunk/bin/splunk start –accept-license
Enable startup:
sudo /opt/splunk/bin/splunk enable boot-start
Check the installation:
sudo /opt/splunk/bin/splunk status
Important: The package filename and supported OS versions depend on the Splunk release. Always download the correct architecture and package from the official website.
9. Installation of Splunk on macOS
Splunk’s macOS support requires special attention. The latest support matrix distinguishes between Splunk Enterprise and Universal Forwarder. Current documentation does not list Splunk Enterprise as supported on Apple Silicon Macs, while Universal Forwarder is available for specified macOS versions and architectures. Therefore, do not assume that an M1, M2, M3 or M4 Mac can host Splunk Enterprise natively.
Splunk Docs+1
How to install Splunk on an Apple silicon Mac machine🍎 | Community
Option A: Install Splunk Universal Forwarder on macOS
If you want to collect macOS logs and send them to a central Splunk Enterprise server, install the supported Universal Forwarder package.
Step 1: Download the package
Visit the Splunk Universal Forwarder download page.
Select the package matching your macOS version and processor architecture.
Step 2: Install the package
For a downloaded DMG package:
- Open the DMG file.
- Run the installer package.
- Follow the installation instructions.
- Complete the initial configuration.
Step 3: Start the Universal Forwarder
For a standard installation, open Terminal:
sudo /opt/splunkforwarder/bin/splunk start –accept-license
Step 4: Configure the receiving Splunk server
Replace the example IP address with your actual Splunk indexer IP:
sudo /opt/splunkforwarder/bin/splunk add forward-server 192.168.1.100:9997
Step 5: Enable forwarding
sudo /opt/splunkforwarder/bin/splunk enable boot-start
Step 6: Verify the configuration
sudo /opt/splunkforwarder/bin/splunk list forward-server
The Universal Forwarder should now be configured to communicate with your Splunk receiving server, provided the receiver is enabled and network connectivity is available.
Option B: Run Splunk Enterprise using a Linux Virtual Machine
For users who want to practise Splunk Enterprise on an Apple Silicon Mac, a practical alternative is to create a supported Linux virtual machine and install Splunk Enterprise inside it.
The process is:
- Install a suitable virtualization platform.
- Create a supported Linux virtual machine.
- Allocate adequate CPU, RAM and storage.
- Download the appropriate Linux Splunk Enterprise package.
- Install and start Splunk inside the virtual machine.
- Access the Splunk Web interface through the VM’s network address.
This approach avoids relying on unsupported native macOS Enterprise installation configurations.
10. Understanding Splunk Search Processing Language (SPL)
One of the most important features of Splunk is its Search Processing Language, commonly called SPL.
SPL is used to search, filter, analyze and visualize machine-generated data.
Security analysts and system administrators use SPL to investigate events and create reports.
Important SPL Commands
| Command | Purpose |
| search | Search for specific events |
| index | Specify the index to search |
| stats | Calculate statistical values |
| timechart | Create time-based charts |
| table | Display selected fields |
| sort | Sort search results |
| top | Display frequently occurring values |
| rare | Display less frequently occurring values |
| eval | Create or calculate fields |
| where | Filter results using expressions |
| dedup | Remove duplicate results |
| chart | Create statistical charts |
10.1 Basic Search Query
To search all events from the main index:
index=main
To search for failed login events:
index=main “failed”
To search for authentication failures:
index=main sourcetype=linux_secure “Failed password”
Note: The index and sourcetype must match the data actually collected in your environment.
10.2 Search Failed Login Attempts
The following query can help identify failed authentication attempts:
index=main “Failed password”
| stats count by src_ip, user
| sort – count
This query:
- Searches for failed password events.
- Counts the occurrences.
- Groups results by source IP and username.
- Sorts the results by frequency.
10.3 Identify Top Source IP Addresses
index=main
| top limit=10 src_ip
This query displays the ten most frequently occurring source IP addresses.
10.4 Generate an Event Count Report
index=main
| stats count by host
| sort – count
This query calculates the number of events generated by each host.
10.5 Generate a Time-Based Report
index=main
| timechart span=1h count
This query displays the number of events received during each hour.
10.6 Search for Critical Errors
index=main (“ERROR” OR “CRITICAL”)
| table _time host source _raw
| sort – _time
This query helps administrators identify important error events.
10.7 Identify Suspicious Login Activity
index=main “Failed password”
| stats count by user, src_ip
| where count > 5
| sort – count
This query identifies users and source IP addresses associated with more than five matching failed-login events within the selected search time range.
These queries are examples for learning and investigation. Production detection rules should be adapted to actual log formats, authentication patterns and organizational requirements.
11. How to Generate Reports in Splunk
Report generation is an important Splunk feature. It enables organizations to convert raw machine data into meaningful information that can be shared with IT administrators, security analysts and management teams.
Splunk allows users to generate reports based on saved search queries and display them in tables, charts and dashboards.
Step 1: Open Splunk Search and Reporting
- Log in to Splunk Web.
- Open the Search and Reporting application.
- Select the search interface.
- Enter your SPL query.
For example:
index=main
| stats count by host
| sort – count
Step 2: Execute the Search
Select the Search button.
Splunk processes the query and displays the results.
The result may appear as a table containing hostnames and event counts.
Step 3: Select the Visualization
Depending on the type of report, select an appropriate visualization:
- Table.
- Column chart.
- Bar chart.
- Pie chart.
- Line chart.
- Area chart.
For example, a bar chart can display the number of events received from each server.
Step 4: Save the Report
After completing the search:
- Select Save As.
- Choose Report.
- Enter a report name.
- Add an optional description.
- Select the appropriate permissions.
- Save the report.
Your saved report will now be available for future use.
Step 5: Schedule the Report
Splunk supports scheduled reports, allowing administrators to run searches automatically.
For example, you can configure:
- Daily security event reports.
- Weekly server monitoring reports.
- Monthly authentication reports.
- Firewall activity reports.
- Failed login reports.
Where supported by the deployment and permissions, configure the schedule and notification settings when saving or editing the report.
Step 6: Export the Report
Splunk provides options to export search results in supported formats, depending on the interface and report type.
Common formats include:
- CSV.
- JSON.
- XML.
- PDF, where supported.
For CSV export, use the export option available in the search results interface.
What attribute in limits.conf can you limit the nu… – Splunk Community
11.1 Example: Daily Security Monitoring Report
Consider an organization that wants to monitor failed authentication attempts across its Linux servers.
Use the following SPL query:
index=main “Failed password”
| stats count by host, user, src_ip
| sort – count
The resulting report can include:
| Host | Username | Source IP | Failed attempts |
| Server-01 | admin | 192.168.1.25 | 15 |
| Server-02 | root | 192.168.1.40 | 12 |
| Server-03 | user1 | 192.168.1.55 | 8 |
Illustrative sample results only, not actual Splunk data.
This type of report can help security administrators identify repeated authentication failures and investigate potentially suspicious access attempts.
12. How to Create a Security Monitoring Dashboard
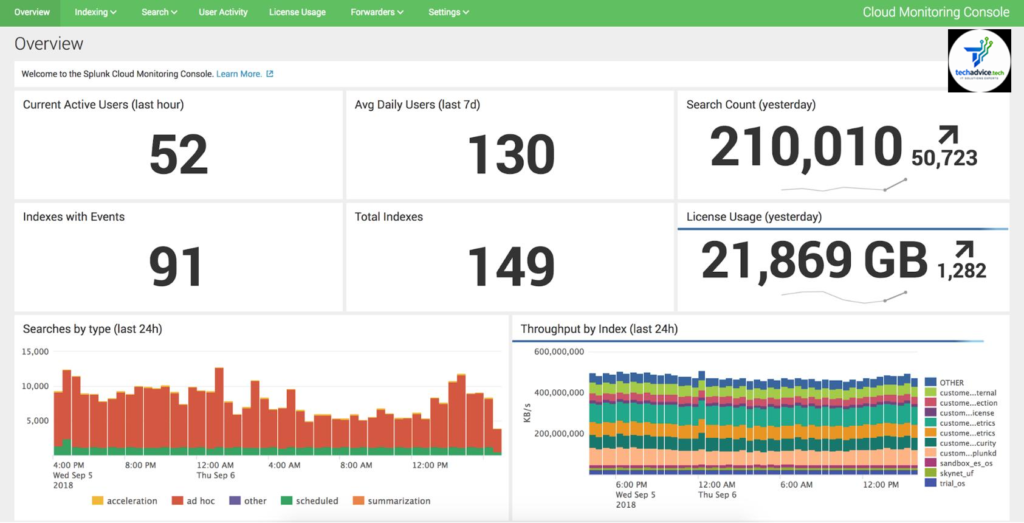
Splunk dashboards provide a visual representation of collected data.
A SOC team can create a dashboard containing different security monitoring panels
Recommended Dashboard Panels
| Dashboard panel | Information displayed |
| Total Events | Total collected events |
| Failed Login Attempts | Authentication failures |
| Top Source IPs | Most frequently occurring IP addresses |
| Critical Errors | Critical system events |
| Host Monitoring | Events received from individual servers |
| Firewall Activity | Firewall-related events |
| Security Alerts | Detected security events |
Example Dashboard Queries
Total event count
index=main
| stats count
Failed login activity
index=main “Failed password”
| timechart span=1h count
Top event-generating hosts
index=main
| top limit=10 host
Critical events
index=main (“ERROR” OR “CRITICAL”)
| stats count by host
To create a dashboard:
- Open Dashboards in Splunk Web.
- Select Create New Dashboard.
- Enter the dashboard name.
- Select the dashboard layout.
- Add a panel.
- Configure the SPL query.
- Choose a visualization.
- Save the dashboard.
You can then add additional panels to create a centralized security monitoring dashboard.
13. Creating Alerts in Splunk
Apart from searching and generating reports, Splunk can generate alerts when specific conditions are detected.
Alerts help administrators respond to unusual activities without continuously monitoring the dashboard.
Common Alert Use Cases
- Multiple failed login attempts.
- Unusual network activity.
- Critical application errors.
- Server availability problems.
- Suspicious authentication events.
- Unexpected changes in system activity.
Example: Failed Login Alert
Use the following SPL query:
index=main “Failed password”
| stats count by src_ip, user
| where count > 10
Steps to Configure an Alert
- Open Search and Reporting.
- Enter the SPL query.
- Execute the search.
- Select Save As.
- Choose Alert.
- Enter the alert name.
- Configure the trigger condition.
- Select the alert frequency.
- Configure available notification actions.
- Save the alert.
When the configured conditions are met, Splunk triggers the alert and executes the selected actions.
Email notifications and other integrations depend on the configured notification system, permissions and available applications.
14. Splunk Advantages
Splunk offers several advantages for IT infrastructure monitoring and cybersecurity operations.
1. Centralized Log Management
It collects logs from different devices and applications into a centralized platform.
2. Real-Time Monitoring
Administrators can monitor incoming events and identify problems quickly.
3. Powerful Search Capabilities
SPL makes it possible to search and analyze large volumes of machine-generated data.
4. Security Monitoring
Splunk helps security analysts investigate suspicious activities and identify potential threats.
5. Custom Dashboards
Users can create dashboards according to their organizational requirements.
6. Automated Reporting
Scheduled reports and alerts reduce repetitive manual work.
7. Scalability
Splunk supports distributed deployments for organizations managing large amounts of data.
8. Integration Capabilities
It supports data collection from different operating systems, applications, security devices and cloud environments.
15. Limitations of Splunk
Despite its capabilities, Splunk also has certain limitations.
| Limitation | Explanation |
| Licensing cost | Enterprise deployments can involve significant licensing and infrastructure costs. |
| Resource requirements | Large deployments require sufficient CPU, RAM and storage. |
| Learning curve | Understanding SPL and administration requires technical knowledge. |
| Data volume | High-volume log ingestion requires capacity planning. |
| Configuration complexity | Distributed deployments require proper planning and management. |
| Data quality | Incorrect or incomplete logs can affect analysis results. |
| Maintenance | Enterprise deployments require regular maintenance and monitoring. |
16. Splunk vs Other SIEM Tools
Splunk is not the only solution available for centralized log management and security monitoring.
Some commonly used alternatives include:
IBM QRadar
A security information and event management platform used for security event correlation, threat detection and investigation.Elastic Security
A security analytics solution built around the Elastic Stack for log analysis, detection and investigation.
Wazuh
An open-source security platform offering capabilities such as security monitoring, file integrity monitoring, vulnerability detection and compliance support.
Microsoft Sentinel
A cloud-based SIEM and security orchestration solution integrated with the Microsoft security ecosystem.
Comparison Table
| Feature | Splunk | QRadar | Wazuh | Sentinel |
| Log management | Yes | Yes | Yes | Yes |
| SIEM capabilities | Yes | Yes | Yes | Yes |
| Search and analytics | SPL | AQL | Search/query tools | KQL |
| Dashboards | Yes | Yes | Yes | Yes |
| Alerting | Yes | Yes | Yes | Yes |
| Deployment | On-prem/cloud | On-prem/cloud options | Self-hosted/cloud options | Cloud |
| Licensing | Commercial options | Commercial | Open source core | Consumption-based |
The actual feature set depends on product editions, integrations and deployment configurations.
17. Practical Splunk Lab for Beginners
If you want to learn Splunk practically, you can create a small test environment.
How to Build a Fully Home Lab SOC | by SÑiper | Medium
Suggested Lab Infrastructure
| Component | Purpose |
| Ubuntu Server | Splunk Enterprise installation |
| Windows Server | Windows event log collection |
| Linux Server | Linux authentication and system logs |
| Splunk Universal Forwarder | Log collection and forwarding |
| Web Browser | Splunk dashboard and reporting |
Suggested Practical Exercises
- Install Splunk Enterprise on Ubuntu Server.
- Configure Splunk Web.
- Install Universal Forwarder on a Windows machine.
- Install Universal Forwarder on a Linux machine.
- Configure the receiving port on Splunk.
- Collect Windows Event Logs.
- Collect Linux authentication logs.
- Search for failed login attempts.
- Identify the top event-generating hosts.
- Create a security monitoring dashboard.
- Generate daily security reports.
- Configure alerts for suspicious activities.
Practical learning objective
By completing these exercises, beginners can understand how a centralized SIEM solution works in a real IT infrastructure.
18. Security Best Practices for Splunk Administrators
When deploying Splunk in an organizational environment, administrators should follow appropriate security practices.
- Use strong administrator passwords.
- Enable HTTPS for Splunk Web.
- Restrict management access to authorized administrators.
- Configure TLS for forwarder-to-indexer communication.
- Restrict network ports through firewall policies.
- Apply role-based access control.
- Regularly review user permissions.
- Monitor data ingestion and license utilization.
- Back up important configuration files.
- Define appropriate data retention policies.
- Keep Splunk components updated.
- Protect sensitive information contained in logs.
- Monitor Splunk’s own internal logs.
For ISO/IEC 27001:2022 environments, Splunk can support centralized security monitoring and provide useful operational evidence. However, retention, access control, monitoring responsibilities and evidence management must be established through organizational policies and procedures.
19. Conclusion
Splunk is a powerful platform for collecting, monitoring, searching and analyzing machine-generated data. Its capabilities make it useful for system administrators, network engineers, cybersecurity professionals, SOC analysts and IT infrastructure teams.
From centralized log management to advanced security analytics, Splunk provides visibility into IT environments and helps organizations investigate incidents, monitor infrastructure and make informed operational decisions.
Understanding Splunk architecture, installation, SPL queries, report generation, dashboards and alert configuration provides a strong foundation for working with SIEM technologies.
For anyone planning a career in cybersecurity, SOC operations, security monitoring or IT infrastructure management, learning Splunk is a valuable technical skill.
For nmap , please followhttps://techadvice.tech/network-scanning-security-auditing-guide/